Every number below comes from the lap model (our lap model), which was built from our kart's real numbers: 360 lb, 72/20 gearing, 10.9 in tires, the 6100 rpm limiter, the 0.69 mi track, and the real 58.33 s best lap from 9/19, which is the only thing the model was tuned to match. Anything the model had to assume (torque curve, drag, 1.5 g of grip) is marked (typical) in its source. The data logger replaces all of it.
Synthetic data. The traces on this page are not measurements. They come from a lap model (our lap model) built from our kart's real numbers - 360 lb, 72/20 gearing, 10.9 in tires, a 6100 rpm limiter, a 0.69 mi track, and the real 58.33 s best lap, which is the only thing the model was tuned to match. The layout is an approximation of Buttonwillow from the track map. When the data logger goes on the kart, the difference between these curves and the real ones becomes the lesson.
The one idea
A trace is the lap written down. Speed against distance is the one to learn first, because every other channel is either a cause of its shape (throttle, brake, grip) or a consequence of it (rpm, g). Two things about the shape carry all the physics: how steep the line is, and how much area sits under it. Steepness is acceleration. Area is distance. Once you can read those two off a graph, you can check any claim anyone makes about the lap without trusting them.
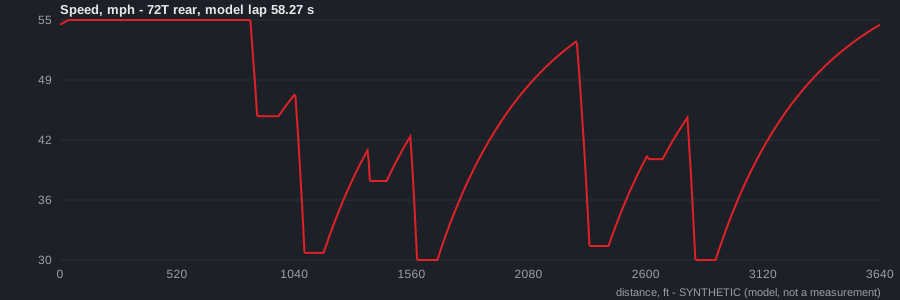
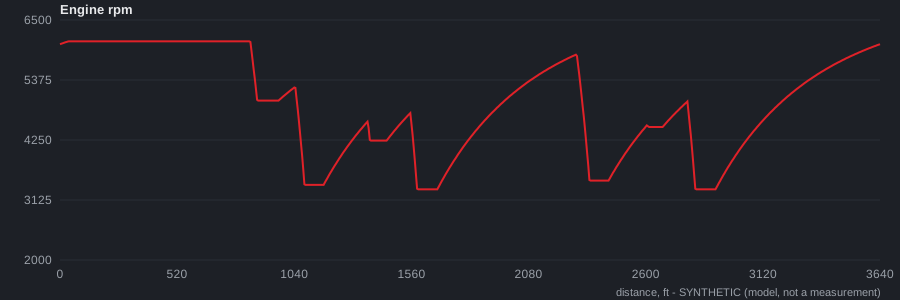
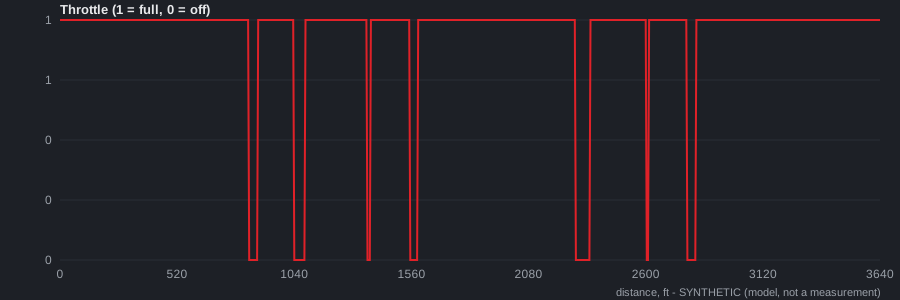
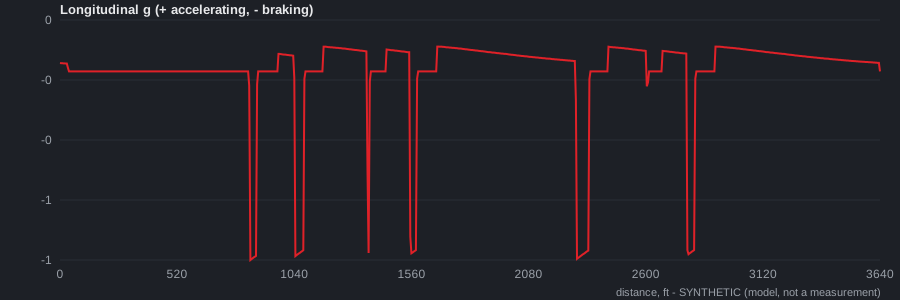
The data behind the charts: SYNTHETIC-lap-72.csv (one row every 5 ft: distance, time, speed, rpm, throttle, brake, lateral g, longitudinal g, head temperature).
Three facts worth knowing
- The x axis is distance, not time, on purpose. Two laps plotted against time drift apart the moment one driver is slower, and the corners stop lining up. Against distance, hairpin 2 is always at the same place on the page, so you can lay one lap over another and compare corner by corner. That is lesson 10.
- A flat top is the limiter. Where the speed trace goes flat at 55 mph and the rpm trace goes flat at 6100, the engine is being cut by its ignition and no amount of throttle matters. The length of the flat is the answer to lesson 2's Q8, read off a graph instead of guessed by ear.
- Braking is a cliff and accelerating is a ramp. Look at the slopes. Speed falls from 55 to 45 mph in about 35 ft, and climbs from 30 to 37 mph over 200 ft. The tire can take 1 g of braking (typical); the engine can only give about 0.08 g of push out of a hairpin. That asymmetry is why entry speed matters so much more than exit acceleration in a low-power kart.
Worksheet
Units on every line. Read the charts with a ruler; then check yourself against the data file. Both are legitimate.
1. Find the limiter. On the rpm chart, find where the line is flat at 6100. Read the start and end distances. How many feet of the lap is the kart on the limiter? Now find the same stretch on the speed chart. What speed is that flat, and does it match lesson 2's table for the 72 (54.9 mph)?
2. Time on the limiter. The kart covers that flat stretch at a constant 55 mph. Convert 55 mph to ft/s (lesson 1's table), then divide the limiter distance from Q1 by that speed in ft/s. How many seconds of the 58.3 s lap are spent with the engine cut? What fraction of the lap is that?
3. Where are the brakes. On the longitudinal-g chart, every dip toward -1.0 is a braking zone. Count them. For each, read the distance where braking starts. Match each one to a drop on the speed trace and to a zero on the throttle trace. Do all three channels agree about where the driver's feet are?
4. The slowest corner. On the speed chart, read the lowest speed of the lap and the distance where it happens. Then read the rpm at that same distance on the rpm chart. Check: rpm should equal speed in mph x 63,360 / 60 / 34.24 (tire circumference in inches) x 3.6 (gear ratio) - lesson 1 Q2 in reverse. Does it? Then, from lesson 2 Q2: is the engine above or below its best torque (about 4000 rpm, typical) in that corner?
5. Slope is acceleration. Pick two points on the ramp out of hairpin 2: 1590 ft (about 30.0 mph) and 1790 ft. Read the speed at 1790 ft from the speed chart. Read the time at both distances from the data file (the time_s column, at dist_ft 1590 and 1790; or estimate: at an average of ~33 mph, how long does 200 ft take?). Acceleration = change in speed / change in time. Give it in mph per second, then in ft/s^2, then in g. Compare with the longitudinal-g chart over the same stretch.
6. Slope the other way. Do the same for the braking zone at the end of the main straight: 835 ft (55 mph) to 865 ft (about 48.5 mph). The data file says that takes about 0.39 s. What is the acceleration in g? Is it negative? Divide it by the Q5 acceleration: how many times harder does the kart brake than it accelerates out of a hairpin?
7. Area is distance. The main straight runs from 0 to 880 ft and the kart crosses it in about 11.0 s. If the speed were a constant 55 mph the whole way, how far would it go in 11.0 s? (Convert mph to ft/s, multiply by seconds.) Is your answer close to 880 ft? Why is it not exactly 880? (Look at the first 35 ft and the last 40 ft of the straight on the speed chart.)
8. The average is the area divided by the width. The whole lap is 3643 ft in 58.27 s. What is the average speed in mph? Now look at the speed chart: is the line above or below that average for most of the lap? Where is it below? (This is lesson 6's point: the slow corners are where the time goes, because the kart spends a long time being slow.)
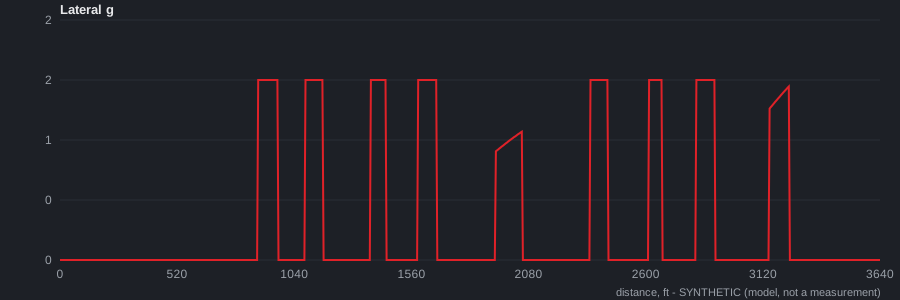
9. Lateral g is a corner detector. On the lateral-g chart, the line sits at 1.5 g in every corner and 0 on every straight. Count the corners. Which corners have a flat top at 1.5 g for the longest? Those are the ones where the model kart is grip-limited (the tire, not the engine, is setting the speed) for the longest. In a real trace, the corners would not all peak at the same g. What would a corner that peaks at 1.2 g be telling you?
10. One point, all channels. At 2000 ft the data file says: 45.8 mph, 5085 rpm, throttle on, no brake, 1.00 g lateral, +0.10 g longitudinal. Write one sentence saying what the kart is doing at that instant, in plain English, using every one of those numbers.
Done? When the data logger goes on the kart, the first thing to do is plot speed against distance for one clean lap and lay this model trace over it. Every place they disagree is a fact about the kart the model didn't know. Bring the overlay to the next sheet.
The two ideas you just used, slope and area, have names: the slope of a graph is its derivative, and the area under it is its integral. That is what calculus is. You have now done it.
Going deeper the calculus he already did