Every number below is off our kart (the kart's setup record: 360 lb, 72/20 gearing; the 2026-09-19 session entry: the 58.33 s best lap) or comes out of our lap model, the model this lesson is about. Inputs the model had to assume are marked (typical) in its source and repeated here where they matter.
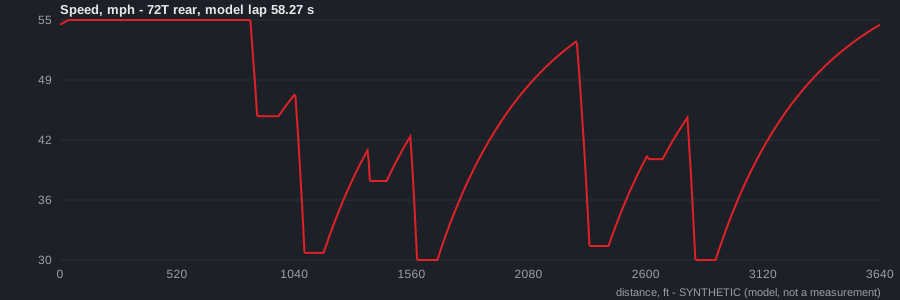
Synthetic data. The traces on this page are not measurements. They come from a lap model (our lap model) built from our kart's real numbers - 360 lb, 72/20 gearing, 10.9 in tires, a 6100 rpm limiter, a 0.69 mi track, and the real 58.33 s best lap, which is the only thing the model was tuned to match. The layout is an approximation of Buttonwillow from the track map. When the data logger goes on the kart, the difference between these curves and the real ones becomes the lesson.
The one idea
A lap is a speed at every point on the track, and lap time is the sum of (distance step) / (speed) over all of them. So if you can say what the fastest possible speed is at each point, you have a lap time. The model says it with three rules you already know: the corner limit from lesson 7 (v = sqrt(a_lat x g x R): a_lat is the cornering grip in g, g is 32.174 ft/s^2, R is the corner radius), the thrust from lesson 2 (torque x ratio / tire radius, minus drag), and the braking limit from lesson 5. Chain them in the right order and a 900-line spreadsheet becomes a lap of our kart, with a lap time you can argue with.
How the model works, in the order it runs
- Cut the track into 5 ft steps. Each step is a straight or a piece of a corner with a radius. 3643 ft, 729 steps.
- Corner limit. For every corner step, the fastest speed the tire can hold is v = sqrt(a_lat x g x R), with a_lat = 1.5 (typical). A straight has no limit except the rev limiter.
- Forward pass (accelerating). Start at the beginning, and at each step add the speed the engine can add in 5 ft: thrust minus drag, divided by mass, capped by the friction circle (what's left after cornering). Never go above the corner limit. That gives the speed curve if you never had to brake.
- Backward pass (braking). Start at the END, walk backwards, and at each step ask: how fast could I have been going 5 ft earlier and still slowed to this speed at 1.0 g (typical)? That gives the speed curve if you never had to accelerate.
- Take the minimum of the two at every step. That is the lap: the forward curve where the engine is the limit, the backward curve where the brakes are, the corner limit in between.
- Add up the time: 5 ft / speed at each step. 729 additions. The 72 comes out at 58.27 s.
Everything else on the trace (rpm, throttle, brake, lateral and longitudinal g) is derived from that speed curve with lesson 1 and lesson 2 arithmetic.
Three facts worth knowing
- The model was tuned to one number. The corner radii in the layout were scaled (all by the same x1.62) until a 1.5 g driver on the 72 lapped in 58.3 s, the real best. Nothing else was fitted. So the model is "a 0.69 mi track with one 880 ft straight and four hairpins that our kart laps in 58.3 s", not Buttonwillow. Its lap time is right by construction; its shape is a guess that the logger will grade.
- A model lets you test a change for free, and that is also the danger. Changing the rear sprocket in the model is one number and two seconds of computer time. Changing it on the kart is a chain break, a mount slide, and a session you can't get back. But the model only knows what you told it, and it was told nothing about weight transfer, tire temperature, or the driver. It answers "what does the physics I typed in predict", never "what will happen".
- Every trace on lessons 9-14 came out of this loop. If a chart on those pages looks wrong to you, this is the page that says why: the rule that drew it is one of the six steps above.
Worksheet
Units on every line.
1. One corner by hand. Hairpin 2 in the model has a radius of 40 ft and the model driver corners at 1.5 g. Compute the speed limit in ft/s, then mph (lesson 1's table). Read the lowest speed near 1590 ft off the speed chart at the top of the page. Do the two numbers agree?
2. The sweeper. The fastest corner in the model has R = 140 ft. Compute its limit. Compare it to the rev limiter speed on the 72 (54.9 mph, lesson 2). Which one is the actual limit in that corner, and what does that mean for whether the driver lifts?
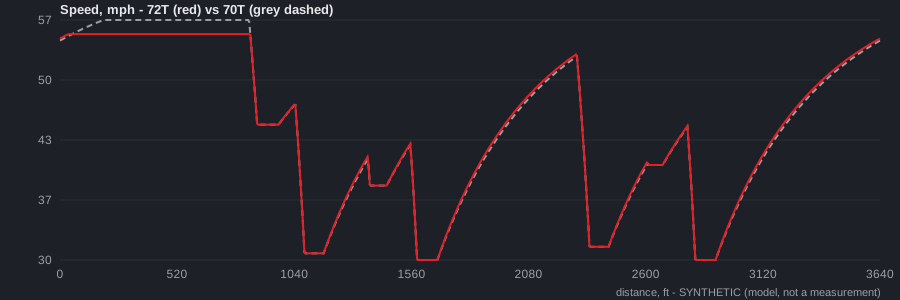
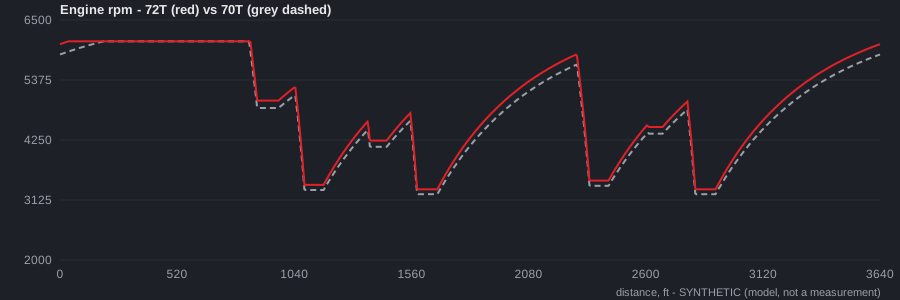
3. Why the sprockets tie. The model says the 70 laps in 58.20 s and the 72 in 58.27 s: 0.07 s apart. The 70 spends 7.8 s on the limiter, the 72 spends 10.1 s. From the rpm chart: where does the 70 gain, and where does it give it back? (Hint: the model says the 70 is 0.25 s quicker down the main straight, and 0.02 s slower out of EACH of the four hairpins.) Add it up. Does the arithmetic explain the 0.07 s?
4. What would break the tie. List three things the model does not know that could make the 70 or the 73 clearly better on the real kart. For each one, say which direction it pushes.
5. Lap time as a sum. The model computes lap time as sum of (5 ft / speed). Do that sum by hand for the main straight only, using a single speed: 54.5 mph for all 880 ft (the kart is on or near the limiter the whole way). How many seconds does the straight take? The model says 10.98 s. How close is your one-speed estimate, and why does it come out slightly low?
6. What the calibration bought. The radii were scaled x1.62 to hit 58.3 s. Before scaling, the same layout lapped in 67 s. Say what that 9 s tells you about the first guess at the layout (were the corners too tight or too open?), and why a model tuned to lap time alone can still have the wrong corners in the wrong places.
7. Test a change for free. In the model, running in a draft (35% less air drag) is worth 0.58 s. Running at 1.42 g instead of 1.5 g and braking at 0.9 g instead of 1.0 g costs 0.94 s. Which of those is the driver and which is the situation? What do those two numbers together say about where the 0.4 s to the leaders on 9/19 most likely lived?
8. What is missing. Lesson 3 says weight moves in corners; the model has one grip number for the whole kart. Lesson 4 says grip depends on tire temperature; the model's 1.5 g is the same on lap 1 and lap 13. Lesson 7 says trail braking overlaps braking and cornering; the model brakes in a straight line, then corners at constant speed, then accelerates. And the model brakes at 1.0 g (typical) while lesson 7 Q4 works out that rear-only brakes on this geometry can't do better than about 0.63 g; the model's corner radii were tuned with that error baked in. For each of the four, say what the real trace will show that the model can't.
9. The night race. The model at 4% denser air (night) laps 0.08 s slower, from drag alone. It does not change engine power with air density. Is that the right sign for the drag effect? Is it the right sign for the engine effect? Which of the two is bigger for an 8 hp engine (typical, lesson 14), and why does the model's answer for the night race have to be wrong?
10. Argue with it. The model spends 10 s of a 58 s lap on the limiter on the 72. If the real kart spends 4 s there, name the two model inputs most likely wrong and the direction of each error.
Done? The day the data logger goes on, overlay the real speed trace on the model's. List the three biggest disagreements, in seconds, with the corner they happen in. Those three are the next three lessons, and none of them are written yet.