Every number below is off our kart (the kart's setup record, the 2026-09-19 session entry: 84 F in the afternoon, about 70 F for the main; the official timing from 9/19) or off the lap model (our lap model), except the ones marked (typical), which are published LO206 figures. The cylinder-head thermocouple replaces them.
Synthetic data. The traces on this page are not measurements. They come from a lap model (our lap model) built from our kart's real numbers - 360 lb, 72/20 gearing, 10.9 in tires, a 6100 rpm limiter, a 0.69 mi track, and the real 58.33 s best lap, which is the only thing the model was tuned to match. The layout is an approximation of Buttonwillow from the track map. When the data logger goes on the kart, the difference between these curves and the real ones becomes the lesson.
The one idea
An engine is a heat machine twice over. It makes power by burning fuel, and how much power depends on how much air it can pull in - and cold air is denser than hot air. It also has to get rid of most of that heat, and an air-cooled single cylinder does it through fins, which means the head temperature follows the throttle with a delay, like a pot on a stove. So the engine you have at 9 PM is not the engine you had at 4 PM: it breathes more, it runs cooler, and neither shows up on a stopwatch unless you know to look.
Three facts worth knowing
- The limiter is an ignition cut. At 6100 rpm (typical) the LO206's coil stops firing every spark, and the engine bounces off that wall. It is not a fuel cut and not a mechanical limit; it is the rule that makes every sealed engine in the class equal at the top. Nothing you do to the engine's heat changes it. Everything you do to heat changes how fast you get there.
- The only temperature sensor the rules allow is under the spark plug. The Briggs rule set permits a thermocouple washer under the plug as long as the sealing washer and heat shield are untouched. An EGT probe in the exhaust, an oxygen sensor, a CO2 sensor: all prohibited, by both the engine rules and the club rulebook. So the cylinder-head temperature (CHT) is the one window we get into what the engine is doing.
- Head temperature lags the throttle by seconds, not instantly. The head is a lump of aluminum with fins; it warms toward a hotter equilibrium (the temperature it would settle at if the throttle stayed open) when the throttle is open and cools toward a cooler one when it isn't, and it takes a while to get there. In the model that time constant is 25 s (typical). Ten seconds of full throttle gets you a third of the way to the hot equilibrium; it takes a minute or more to settle. That is why a CHT trace looks smooth while the throttle trace is a square wave.
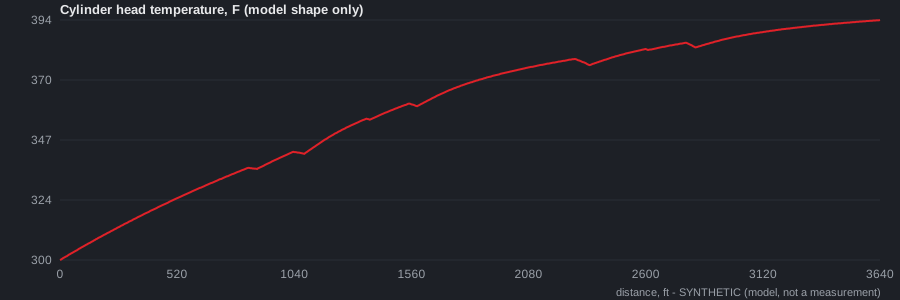
The model lap starts the head at 300 F and it climbs all lap, because the throttle is open 93% of the time and the head hasn't caught up yet. That climb is a start-of-lap artifact, not a prediction; on a real trace the head settles somewhere in the 350-420 F range (typical) after a few laps and then wobbles around it. The shape to learn is the slow curve, not the number.
Worksheet
Units on every line.
1. Absolute temperature. Lesson 1's table: C to K is add 273.15. Convert 84 F and 70 F to kelvin (F to C first: C = (F - 32) x 5/9). What is the ratio of the two absolute temperatures, warm-up over main? Why does that ratio come out nothing like 84/70?
2. Density. At the same pressure, air density is inversely proportional to absolute temperature: cool the air by 1% in kelvin and it gets 1% denser. By what percentage was the air denser for the main (about 70 F) than for the afternoon warm-up (84 F)?
3. Power. An engine's power is roughly proportional to the mass of air it pulls in per revolution (typical rule; the carburetor and ignition don't change). Using Q2, by what percentage more power did the LO206 make at 9 PM than at 4 PM? The engine makes about 8 hp (typical): how many horsepower is that percentage?
4. Where the extra power goes. More power means more thrust everywhere the engine is below the limiter - and nothing at all once it's on the limiter. From the lap model, the 72 spends 10.05 s of a 58.27 s lap on the limiter. What fraction of the lap can the extra power act on? Where on the track is it useless?
5. A rough lap-time estimate. At 40 mph on the 72 the model has the engine at 4440 rpm making about 65 lb of thrust against about 23 lb of drag and rolling resistance, so 42 lb of net push. Add 2.6% to the thrust only. What is the new net push, and by what percentage did net acceleration go up? Why is that percentage bigger than 2.6%?
6. What the model got wrong. The model's night run raised air density by 4% and the lap got SLOWER by 0.08 s (58.35 vs 58.27). Which effect did it include, and which did it leave out? Using Q5, would the real night engine gain or lose time overall?
7. Lag. After 10 s of full throttle the head has moved 33% of the way from its cool equilibrium to its hot one (model, time constant 25 s). Two full-throttle stretches on our layout: the main straight (about 11 s) and the run after hairpin 2 (about 6 s). Which one shows up more in the CHT trace? Why can't you read a CHT trace like a throttle trace?
8. Hot engine, less power. An air-cooled engine loses power as the head gets hotter: hot metal heats the incoming air, which is Q2 in reverse, and the ignition timing that's right for a cool engine is slightly wrong for a hot one. Say in one sentence why a 13-lap main is a harder test of cooling than a 3-lap qualifying session, and what you would expect the CHT trace to do over those 13 laps.
9. The 9/19 fade, two ways. In the main, laps 10-13 went 59.06, 59.41, 59.78, 1:00.40, 1:02.86 while the leaders held 58.4. The cause turned out to be something scraping on the kart. Sketch, in words, what the CHT trace would have looked like over those laps if the cause had been overheating instead. Then sketch what it would look like for the scrape. What single feature separates the two?
10. What to write down. The thermocouple gives one number, and it means nothing on its own. List the four things that have to be logged next to it (per session) for a CHT reading to be comparable between the 4 PM warm-up and the 9 PM main.
Done? Buy the thermocouple washer before the logger, not after. The first session with it, log CHT, air temperature and lap time together, and this sheet gets a second page with a real curve where the model one is now.