Every number below comes from the lap model (our lap model) built from our kart's real numbers, plus one real comparison at the end: the official timing from 9/19, where the three leaders ran 58.4 s laps nose-to-tail and you ran 58.8 s alone. Model inputs the kart hasn't measured yet (torque curve, drag, grip) are marked (typical) in the model's source.
Synthetic data. The traces on this page are not measurements. They come from a lap model (our lap model) built from our kart's real numbers - 360 lb, 72/20 gearing, 10.9 in tires, a 6100 rpm limiter, a 0.69 mi track, and the real 58.33 s best lap, which is the only thing the model was tuned to match. The layout is an approximation of Buttonwillow from the track map. When the data logger goes on the kart, the difference between these curves and the real ones becomes the lesson.
The one idea
A lap time is one number, and one number can't tell you where you lost. Two speed traces on the same distance axis can. Wherever the slower line sits under the faster one, time is leaking, and the delta-time chart adds up that leak from the start line to the finish so you can read, at any point on the track, how far behind you are and how fast the gap is growing. Steps in the delta are corners that cost you. Flats are places you matched. The whole job of a race engineer with a data logger is reading that one chart.
Driver A is the model at 1.5 g of grip and 1.0 g of braking (typical). Driver B is the same kart with 1.42 g of grip and 0.9 g of braking: a driver leaving a little on the table everywhere. B is 0.94 s slower.
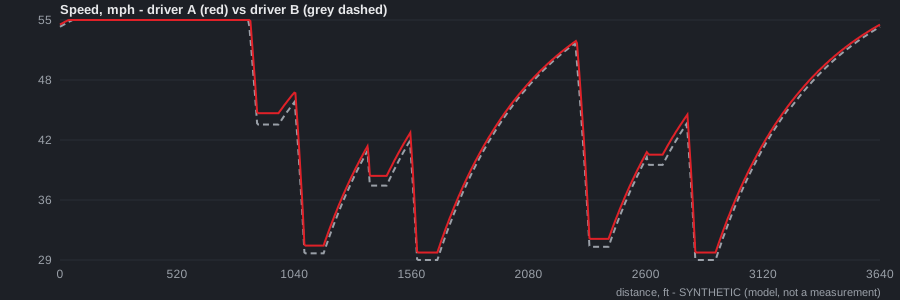
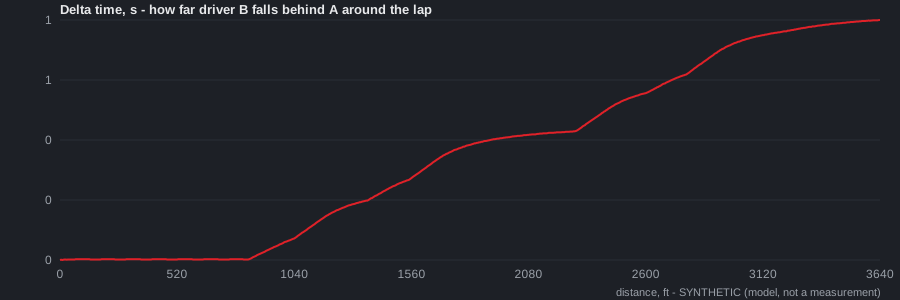
Data: SYNTHETIC-lap-72.csv (A) and SYNTHETIC-lap-72-driverB.csv (B).
Three facts worth knowing
- The delta chart is the running total of the speed difference. Each 5 ft of track costs each driver a little time: 5 ft divided by speed. The slower driver spends slightly more per step, and the delta chart just adds those tiny differences up from the start line. In lesson 9's words, the delta is the area under the "how much slower" curve. Where the delta is rising, B is losing; where it's flat, B is matching; if it ever fell, B would be gaining.
- A small speed gap in a slow place costs more than a big gap in a fast one. Time per foot is 1/speed. Being 1 mph down at 30 mph costs three times as much per foot as being 1 mph down at 52 mph. That is why B, who is only about 0.8 mph slower at every apex (the slowest point of a corner), loses most of a second: the losses are in the slow corners and the ramps out of them.
- A driver who is down everywhere by a little is the hardest case. If B lost all 0.94 s in one corner, the fix would be one corner. B loses about a tenth in every corner and two tenths on every long exit. That pattern says "grip and commitment," not "line at turn 4." The data can tell those two apart; a stopwatch cannot.
Worksheet
Units on every line. Read from the charts first; check against the data files second.
1. Match the axes. Both traces are plotted against distance, not time. In one sentence, why? (Lesson 9, fact one.) What would the overlay look like if it were plotted against time instead, given that B is 0.94 s slower by the end?
2. Read the gap at the corners. On the delta chart, read the delta at 880, 1090, 1380, 1590, 2355, 2615, 2825 and 3640 ft. Write them in a column. Then write the step between each pair: how much did B lose in that section?
3. Where the time goes. From Q2, rank the sections by how much B lost. Which section costs the most? Which the least? The main straight (0 to 880 ft) is the flattest part of the delta chart: why does B lose almost nothing there, given that B has less grip?
4. Time per foot. At the apex of hairpin 1 (1090 ft), A is at 30.7 mph and B at 29.9 mph. Convert both to ft/s. How long does each take to cover 5 ft there? What is the difference, in thousandths of a second? Now do the same on the main straight, where A and B are both at 55 mph. Which place costs B more time per foot, and by how many times?
5. Why the delta is a running sum. Take the difference from Q4 at the hairpin (seconds per 5 ft). Suppose B is that much slower for the whole 60 ft of the hairpin: multiply by the number of 5 ft pieces in 60 ft to get B's loss over the hairpin itself. Compare that with the delta step you read at 1090 ft in Q2. Are they the same size? If the step is bigger, where did the rest of it come from?
6. Segment times. Section 1590 to 2355 ft: A takes 12.77 s, B takes 12.97 s. Section 2355 to 2615: A 5.09 s, B 5.21 s. Which section is longer in time? In which does B lose more in absolute seconds? In which does B lose more as a percentage of the section? Which of those two numbers should you care about, and why?
7. Minimum speeds. A's slowest apex is 30.0 mph; B's is 29.2 mph. That is 0.8 mph, or 2.7%. B's grip is 1.42 g against A's 1.5 g: 5.3% less. Why does 5.3% less grip give only 2.7% less corner speed? (Hint: lesson 7 Q2: corner speed v = sqrt(a x R), where a is the grip in ft/s^2 and R is the corner radius in ft. What happens to a percentage when you take a square root?)
8. Reading a chart you haven't seen. Sketch, without data, what the delta chart would look like for a driver who is identical to A everywhere except that he brakes 20 ft too early for hairpin 1 and nowhere else. Where is the one step? Is the chart flat before it and flat after it? What does "flat after it" mean about time already lost?
9. The real one: the draft. In the 9/19 main the leaders ran 58.4 s nose-to-tail and you ran 58.8 s alone. The model can reproduce that: the same kart with 35% less aero drag (a tow, typical) laps 0.58 s faster.
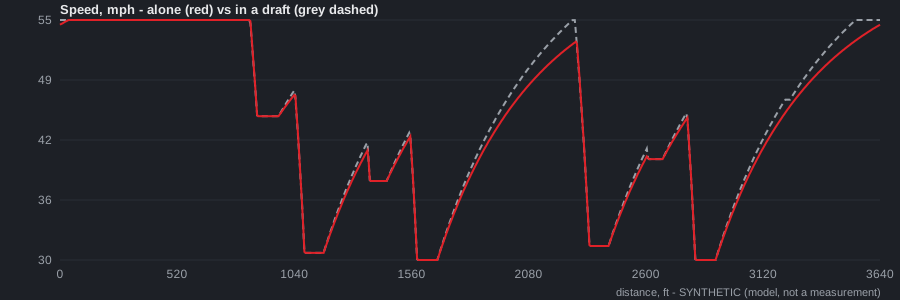
The drafted kart's delta against the lone kart (negative = the drafted kart is ahead), read at five of the Q2 checkpoints: 880 ft -0.001, 1590 ft -0.057, 2355 ft -0.302, 2825 ft -0.347, 3640 ft -0.585. Where does the draft gain the most? Where does it gain nothing? Why does it gain nothing on the main straight, where you'd expect a tow to matter most? (Lesson 2, fact three.)
10. What to look at first. You get one real overlay from the logger: your lap against a faster teammate's. Write down, in order, the three things you will read off it before you form any opinion about the kart.
Done? At the next race the timing system posts section times (the loops around the track) for every kart. Copy yours and the class winner's for your best laps, section by section, into a two-column table, and subtract. That is a delta chart with about six points on it, and it is real. Bring it to the next sheet.