Every number below is off our kart (the kart's setup record, the official timing from 9/19) or off the lap model (our lap model), except the ones marked (typical): the kart's drag area, the size of a draft, and the rolling resistance. The logger's speed trace on the straight, alone and in a tow, replaces all three.
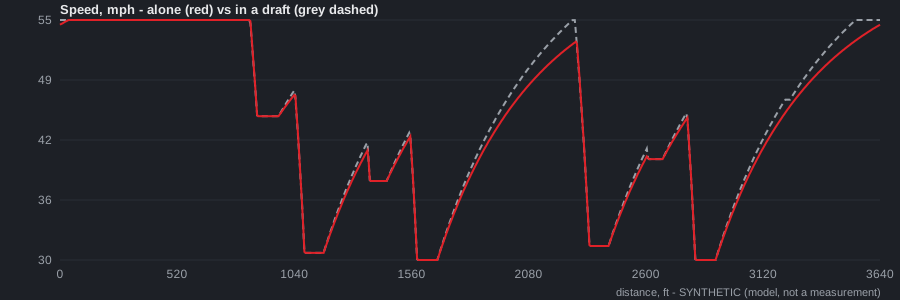
Synthetic data. The traces on this page are not measurements. They come from a lap model (our lap model) built from our kart's real numbers - 360 lb, 72/20 gearing, 10.9 in tires, a 6100 rpm limiter, a 0.69 mi track, and the real 58.33 s best lap, which is the only thing the model was tuned to match. The layout is an approximation of Buttonwillow from the track map. When the data logger goes on the kart, the difference between these curves and the real ones becomes the lesson.
The one idea
Air drag grows with the square of speed: drag = 1/2 x (air density) x (drag area) x speed^2. Double the speed, four times the drag, eight times the power to push through it. At 30 mph a kart barely notices the air; at 55 mph the air is eating most of the engine. A kart in a draft is borrowing the kart in front's hole in the air, and on a track with an 880 ft straight that hole is worth more than any sprocket.
Three facts worth knowing
- At the limiter, the engine is spending about 70% of its power on air. 8 hp (typical) at the top of the rev range; 5.6 hp of it goes into drag and rolling resistance at 55 mph (model numbers). That is why a draft matters in this class: there's no surplus power to waste.
- A draft cuts the drag, not the speed limit. Lesson 2's fact: if you're on the limiter, the tow can't make you faster. The model shows exactly where the 0.58 s comes from - and it is not the main straight.
- The three karts ahead of you on 9/19 were sharing one hole in the air. The leaders ran nose to tail at 58.4; alone, you ran 58.8. The model's draft run comes out 0.58 s faster than the alone run. That gap and this number are the same size, and neither is a coincidence.
Worksheet
Units on every line.
1. Drag at three speeds. Air density 1.20 kg/m^3 (sea level, 20 C), drag area CdA = 0.40 m^2 (typical for a seated kart and driver). Drag = 1/2 x rho x CdA x v^2, where rho is the air density above, CdA the drag area, and v the speed in m/s (1 mph = 0.447 m/s). Compute drag in newtons at 30, 45 and 55 mph, then convert to pounds (lesson 1 table). Check: 30 to 55 mph is 1.83x the speed; how many times the drag?
2. Power. Power = force x speed. At each of the three speeds, how many watts does it take to push through the air? Convert to horsepower (1 hp = 745.7 W). Now rolling resistance: a force of 0.015 x 360 lb (typical), converted to newtons; multiply that force by each speed to get its power too. Adding air and rolling together, what total horsepower is the kart using at 55 mph, and what fraction of an 8 hp engine is that?
3. The draft. A tow removes about 35% of aero drag (typical, close behind another kart). How many pounds of drag does that remove at 55 mph? At 45 mph? Compare with the 69 lb of thrust the engine makes at peak torque (lesson 2 Q3).
4. Where the time comes from. The model's draft run is 0.585 s faster over the lap. The cumulative gain, by distance: 0.001 s at the end of the main straight (880 ft); 0.06 s by 1590 ft; 0.30 s by 2355 ft; 0.58 s at the line. Why is the gain on the 880 ft main straight essentially zero? Where is the draft actually paying? (Lesson 2 Q7 is the answer; say it in one sentence.)
5. Gear for the draft. The 70T rear (ratio 3.500) is 1.6 mph faster at the limiter than the 72. In a draft, the kart reaches the limiter sooner on every straight. Explain why the combination "draft + 70T" gains where "draft + 72T" is stuck, and why "alone + 70T" gains nothing on the main straight and loses out of every hairpin.
6. Buttonwillow vs Bakersfield. Bakersfield: 0.5 mi, your best 31.14 s, average 57.8 mph. Buttonwillow: 0.69 mi, 58.33 s, average 42.6 mph. Which track has more of its lap at high speed, and at which one is a draft worth more per lap? Why does the model's draft gain come out of the medium straights rather than the fastest part of either track?
7. Ten laps of it. The leaders' 58.4 vs your 58.8 alone is 0.4 s per lap. Over the 13-lap main, ignoring the late fade, how far behind does that put you at the flag, in seconds and in feet at 42.6 mph average? Compare with the real gap to third place at lap 9 (2.8 s), before the scrape started. Does the draft explain most of that 2.8 s?
8. Being the leader. If you are at the front of a three-kart train, you get no draft and the two behind get yours. On a track where a draft is worth 0.58 s a lap, what does that say about leading with two laps to go versus sitting second? What does it say about qualifying, where everyone is alone?
9. Density again. Lesson 11: the 9 PM air was 2.6% denser than the 4 PM air. Drag scales with density. How much more drag at 55 mph, in pounds? How does that compare with what the draft removes?
10. Measure it. With a speed trace from the logger, how would you measure CdA directly? Hint: on the limiter you can't; find the part of the straight where the kart is coasting or decelerating with the throttle shut, and use the slope of the speed trace (lesson 9). Write the equation you'd solve.
Done? Next race, get a tow on purpose for one lap of practice, and run one lap alone, back to back. Two speed traces on the main straight answer Q3 and Q10 with real numbers, and the (typical) on the drag area comes off.